
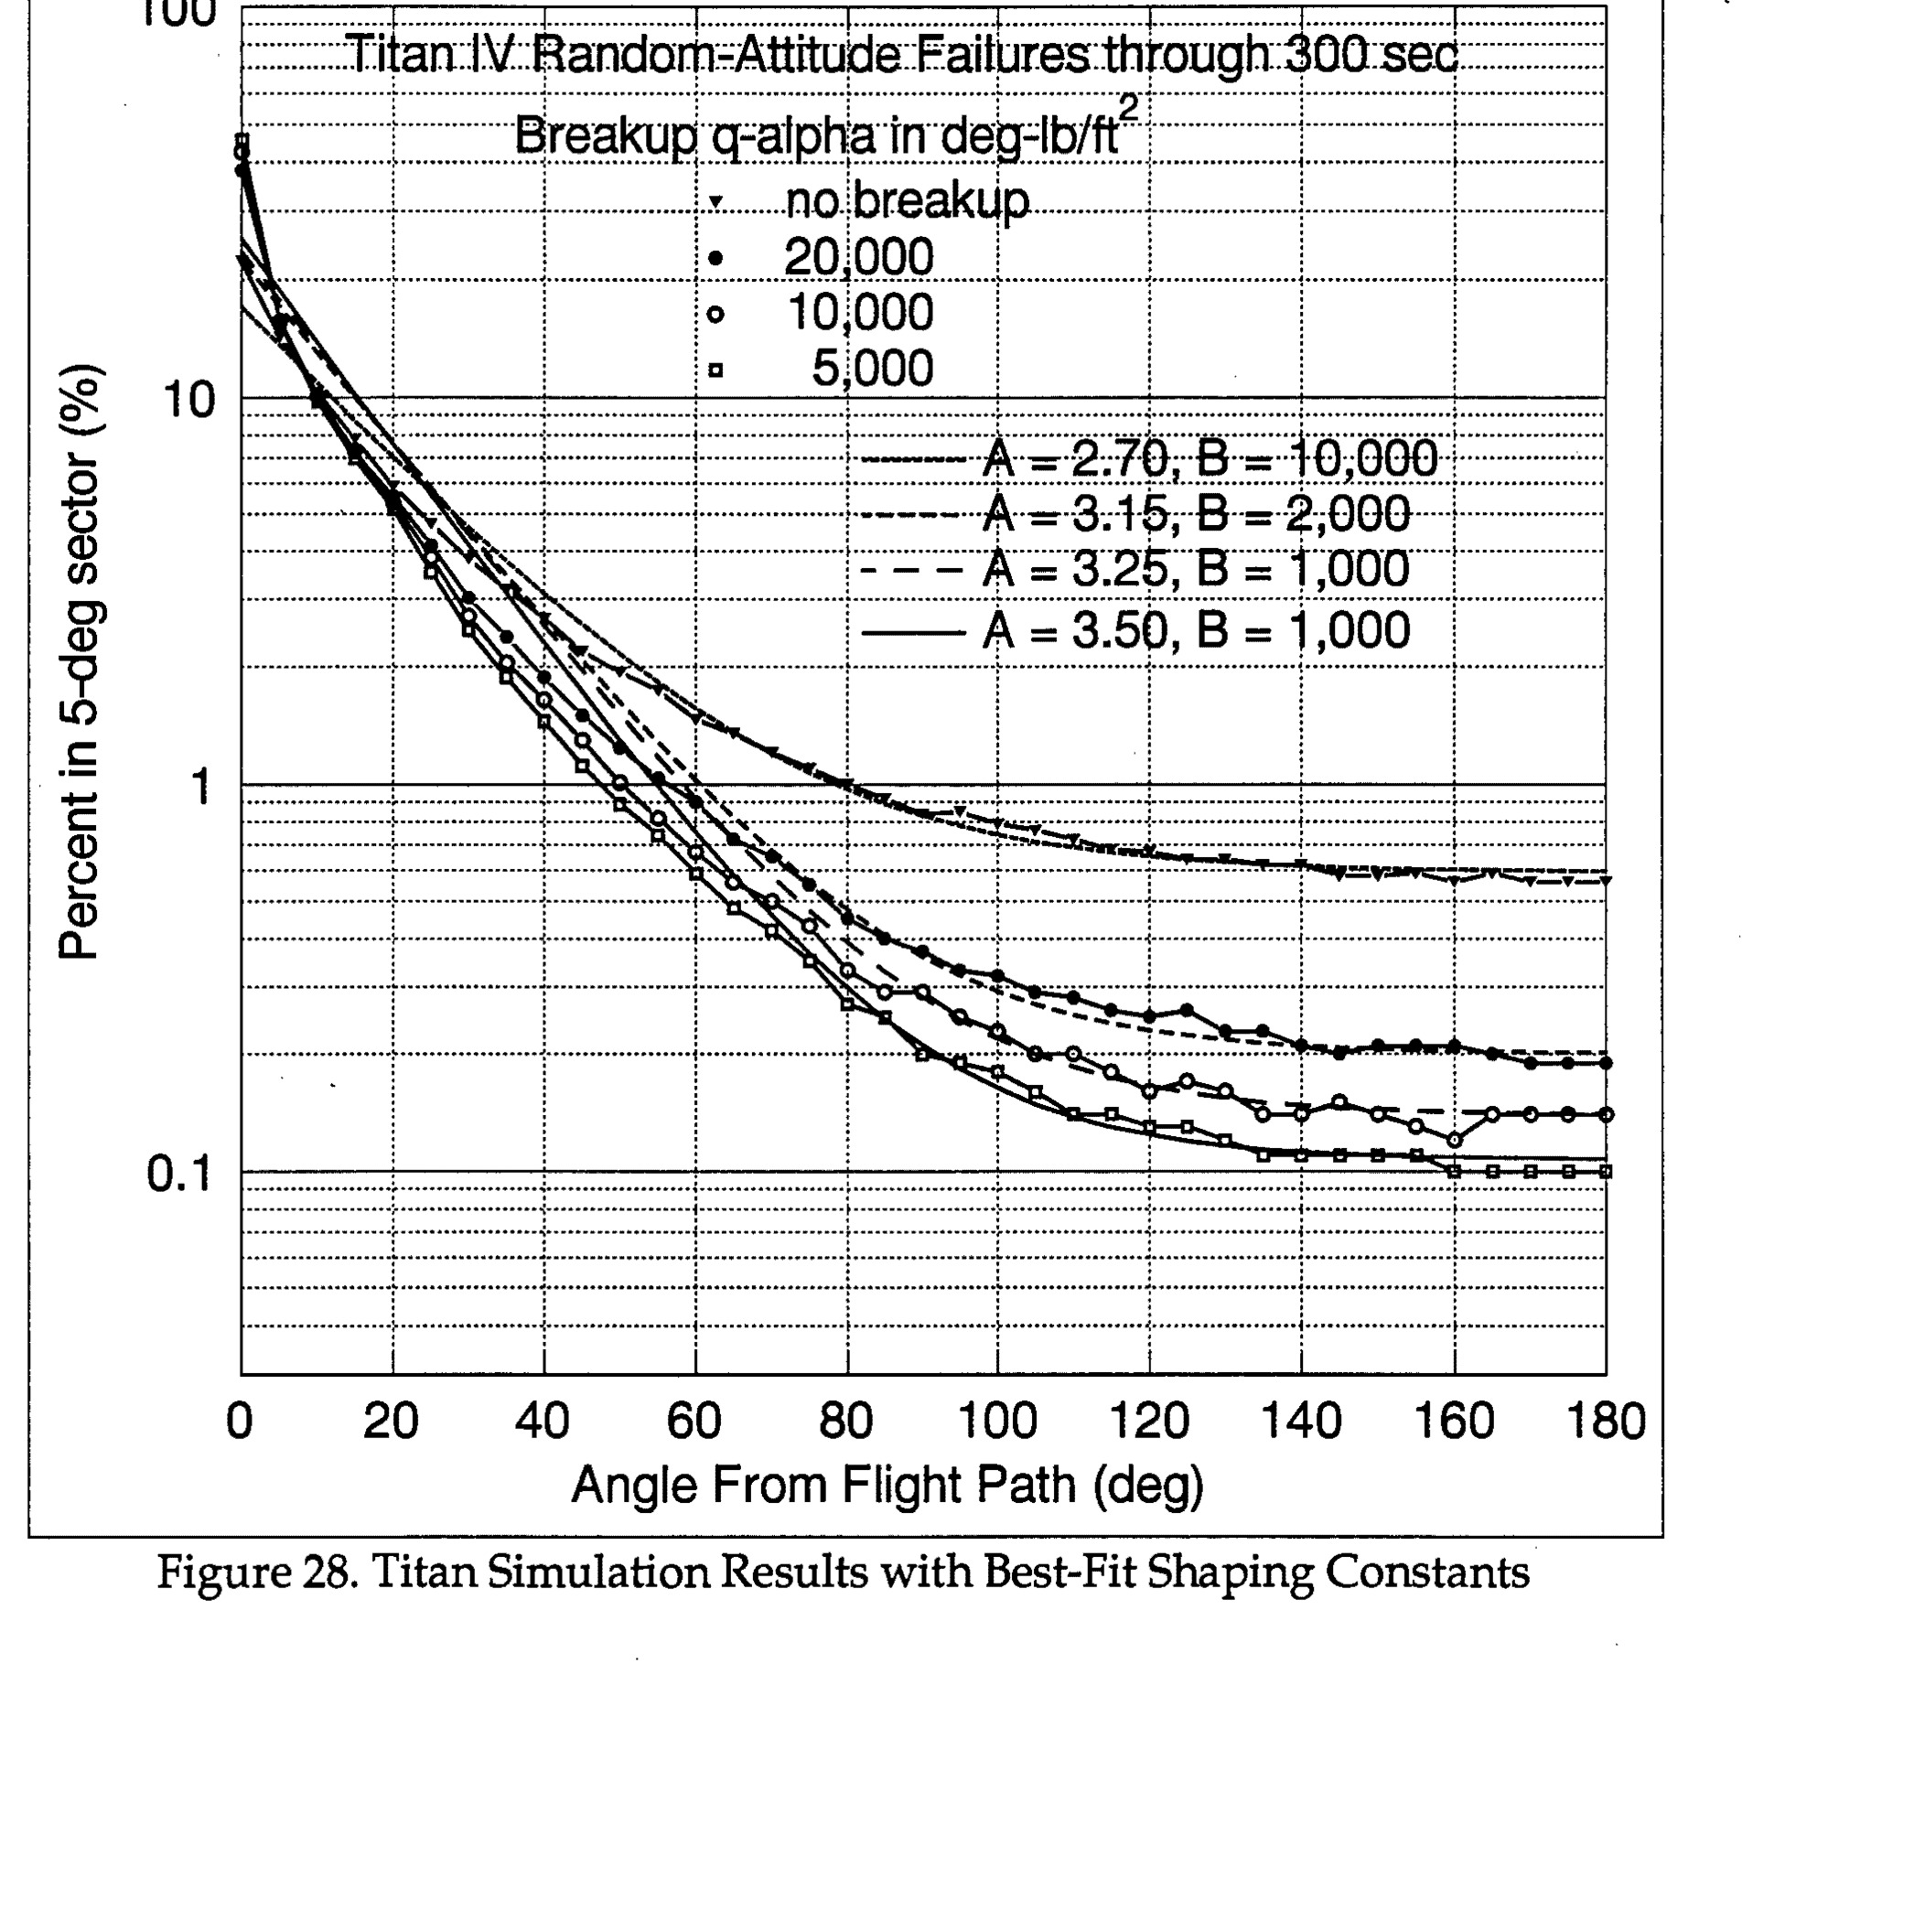
Titan IV Random-Attitude Failures through 300 sec, showing Breakup α-alpha in deg-lb/ft² with various parameters (no breakup, 20,000, 10,000, 5,000) and curves for A=2.70, B=10,000; A=3.15, B=2,000; A=3.25, B=1,000; A=3.50, B=1,000. Y-axis: Percent in 5-deg sector (%), logarithmic scale 0.1 to 100. X-axis: Angle From Flight Path (deg), 0 to 180.
photoRelated photos
Chart· p.32· RTI
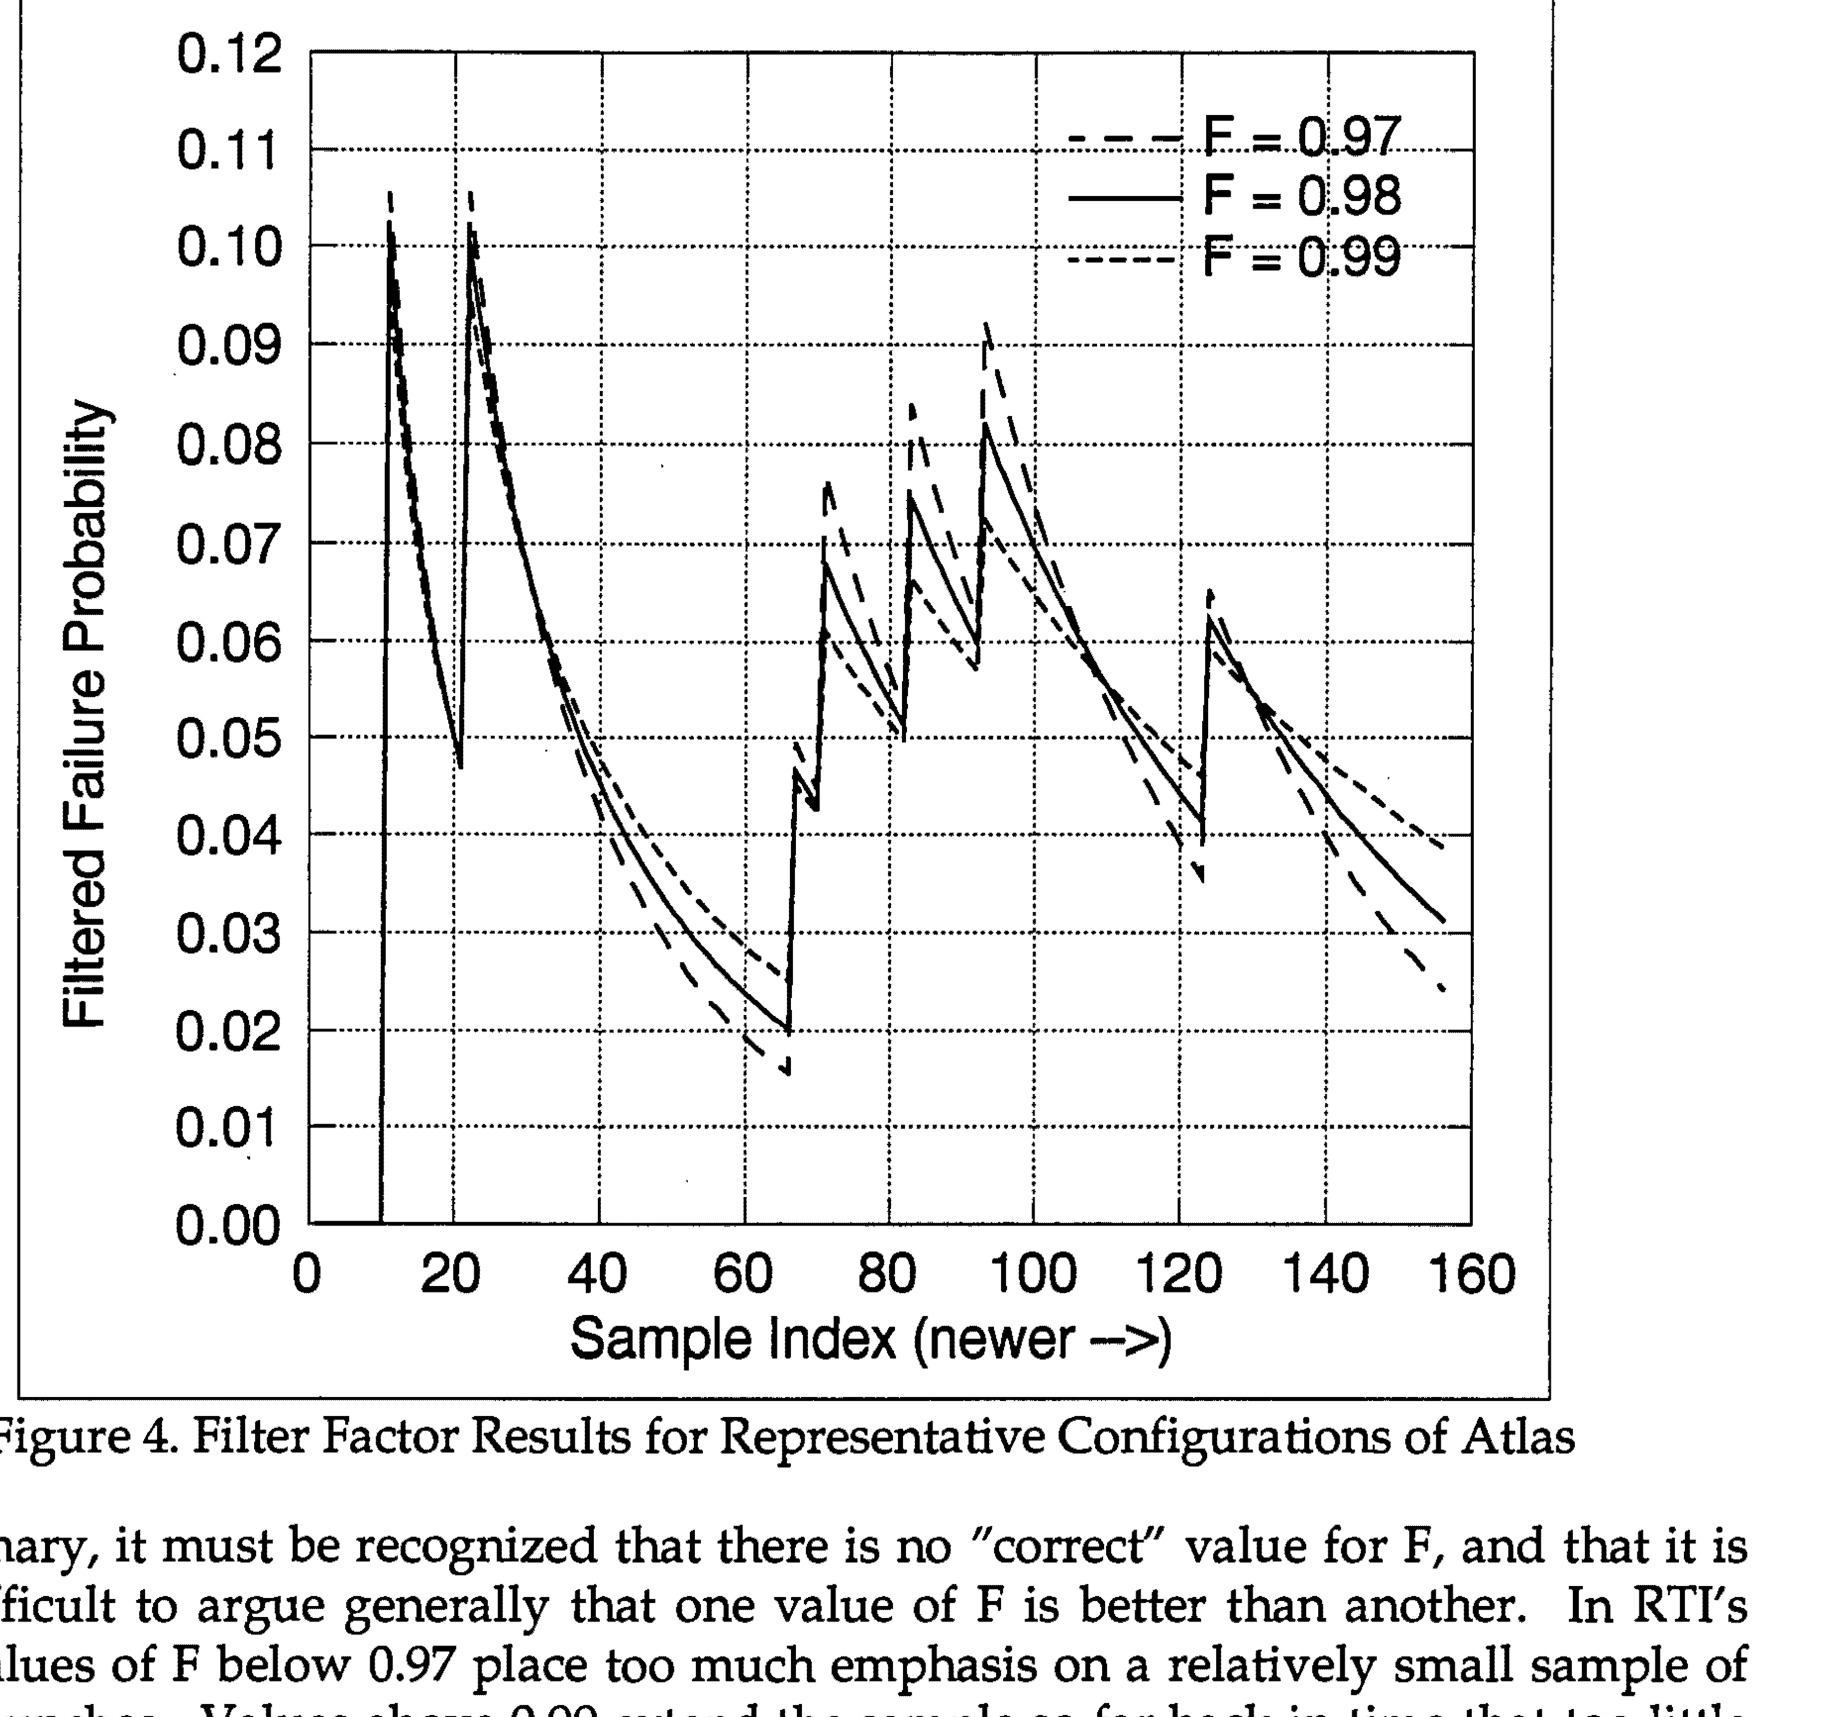
Filter Factor Results for Representative Configurations of Atlas
Chart· p.46· RTI
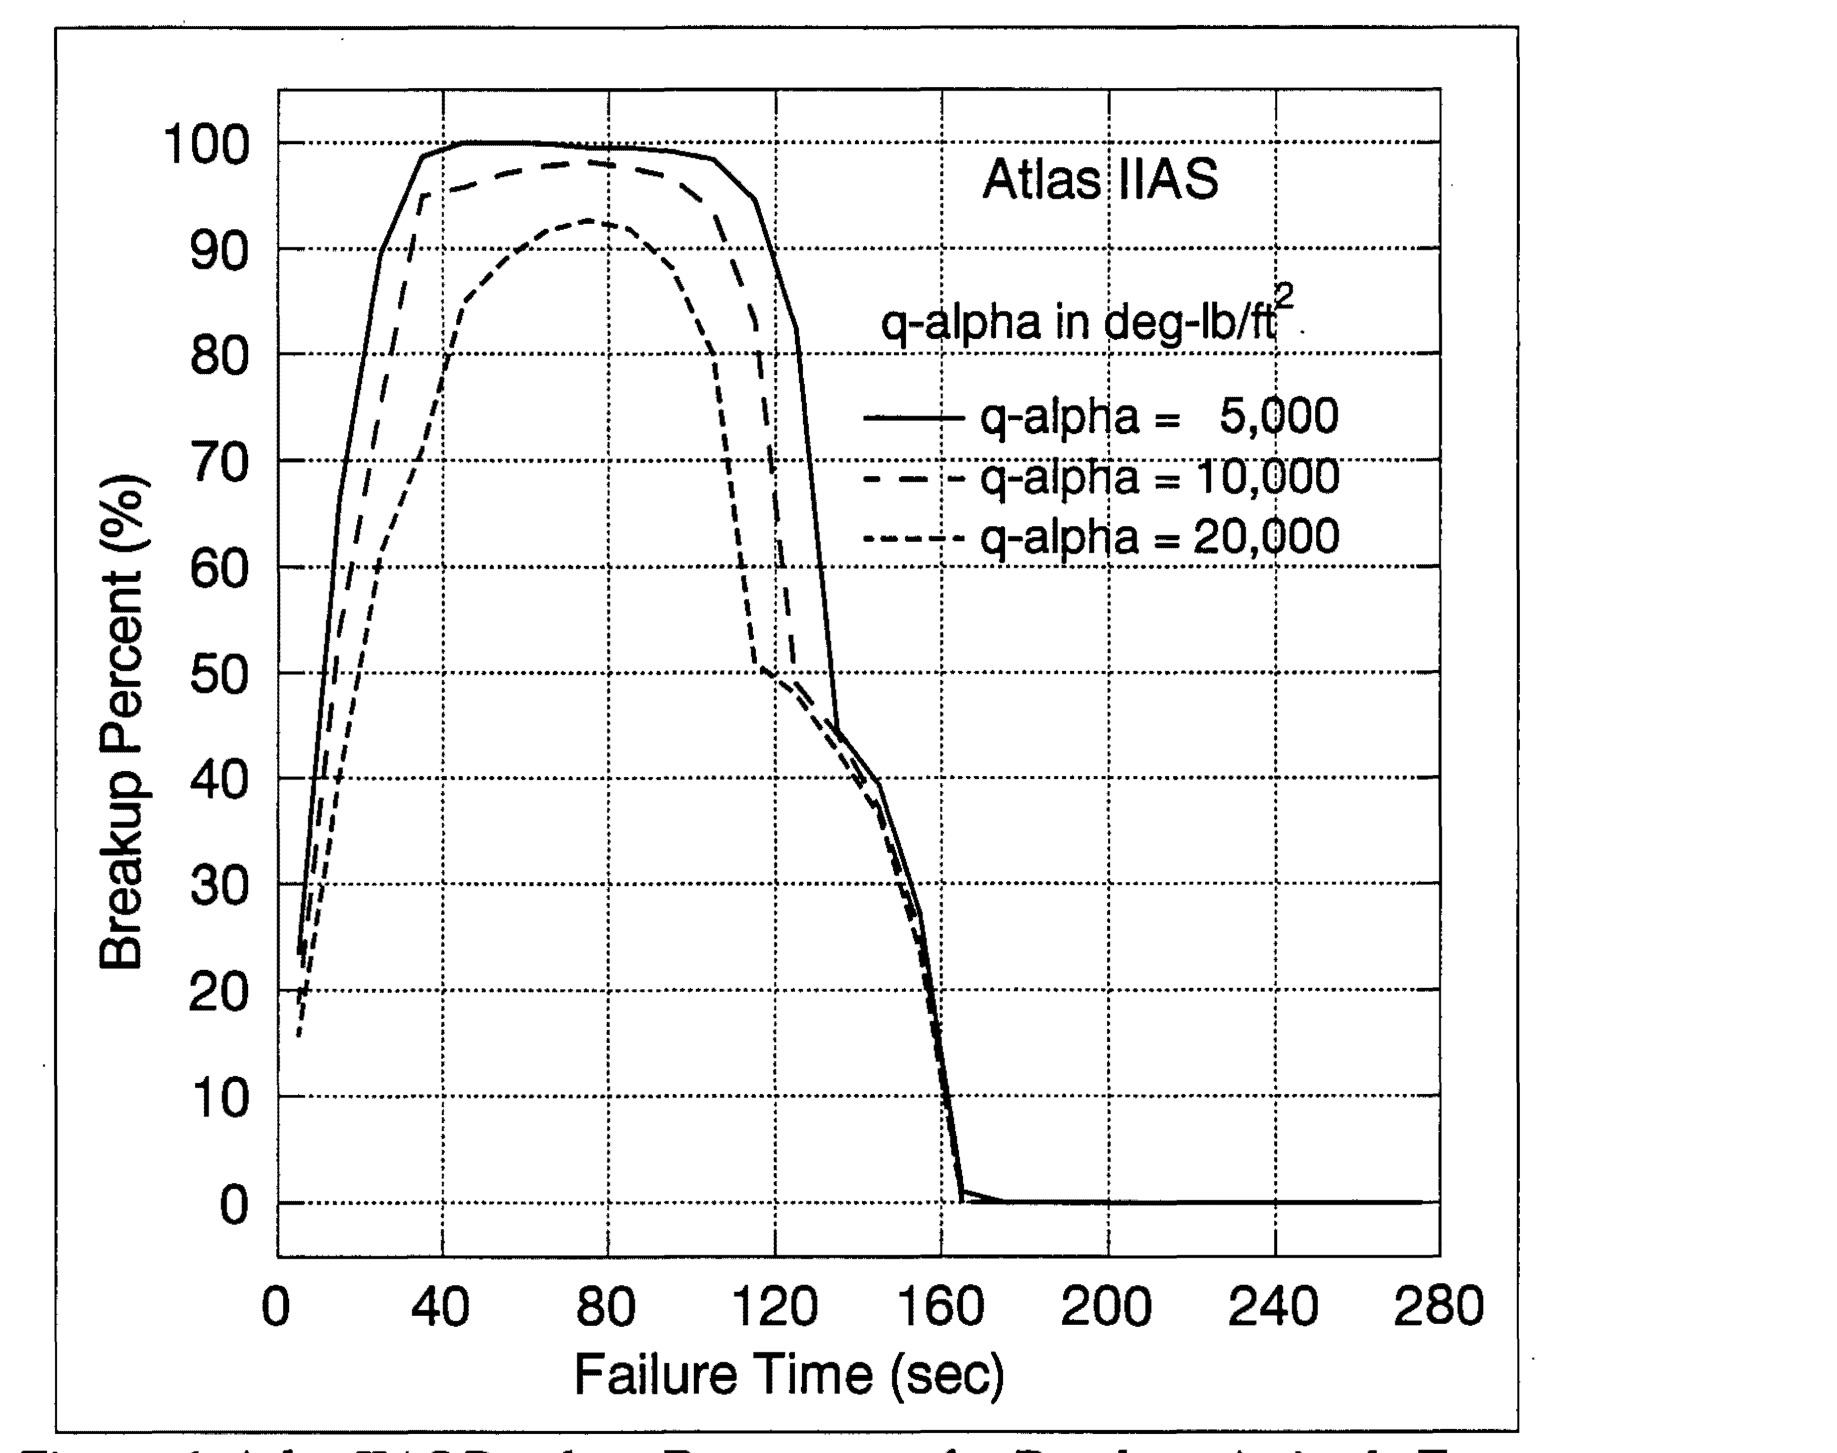
Figure 6. Atlas IIAS Breakup Percentages for Random-Attitude Turns
Chart· p.51· RTI
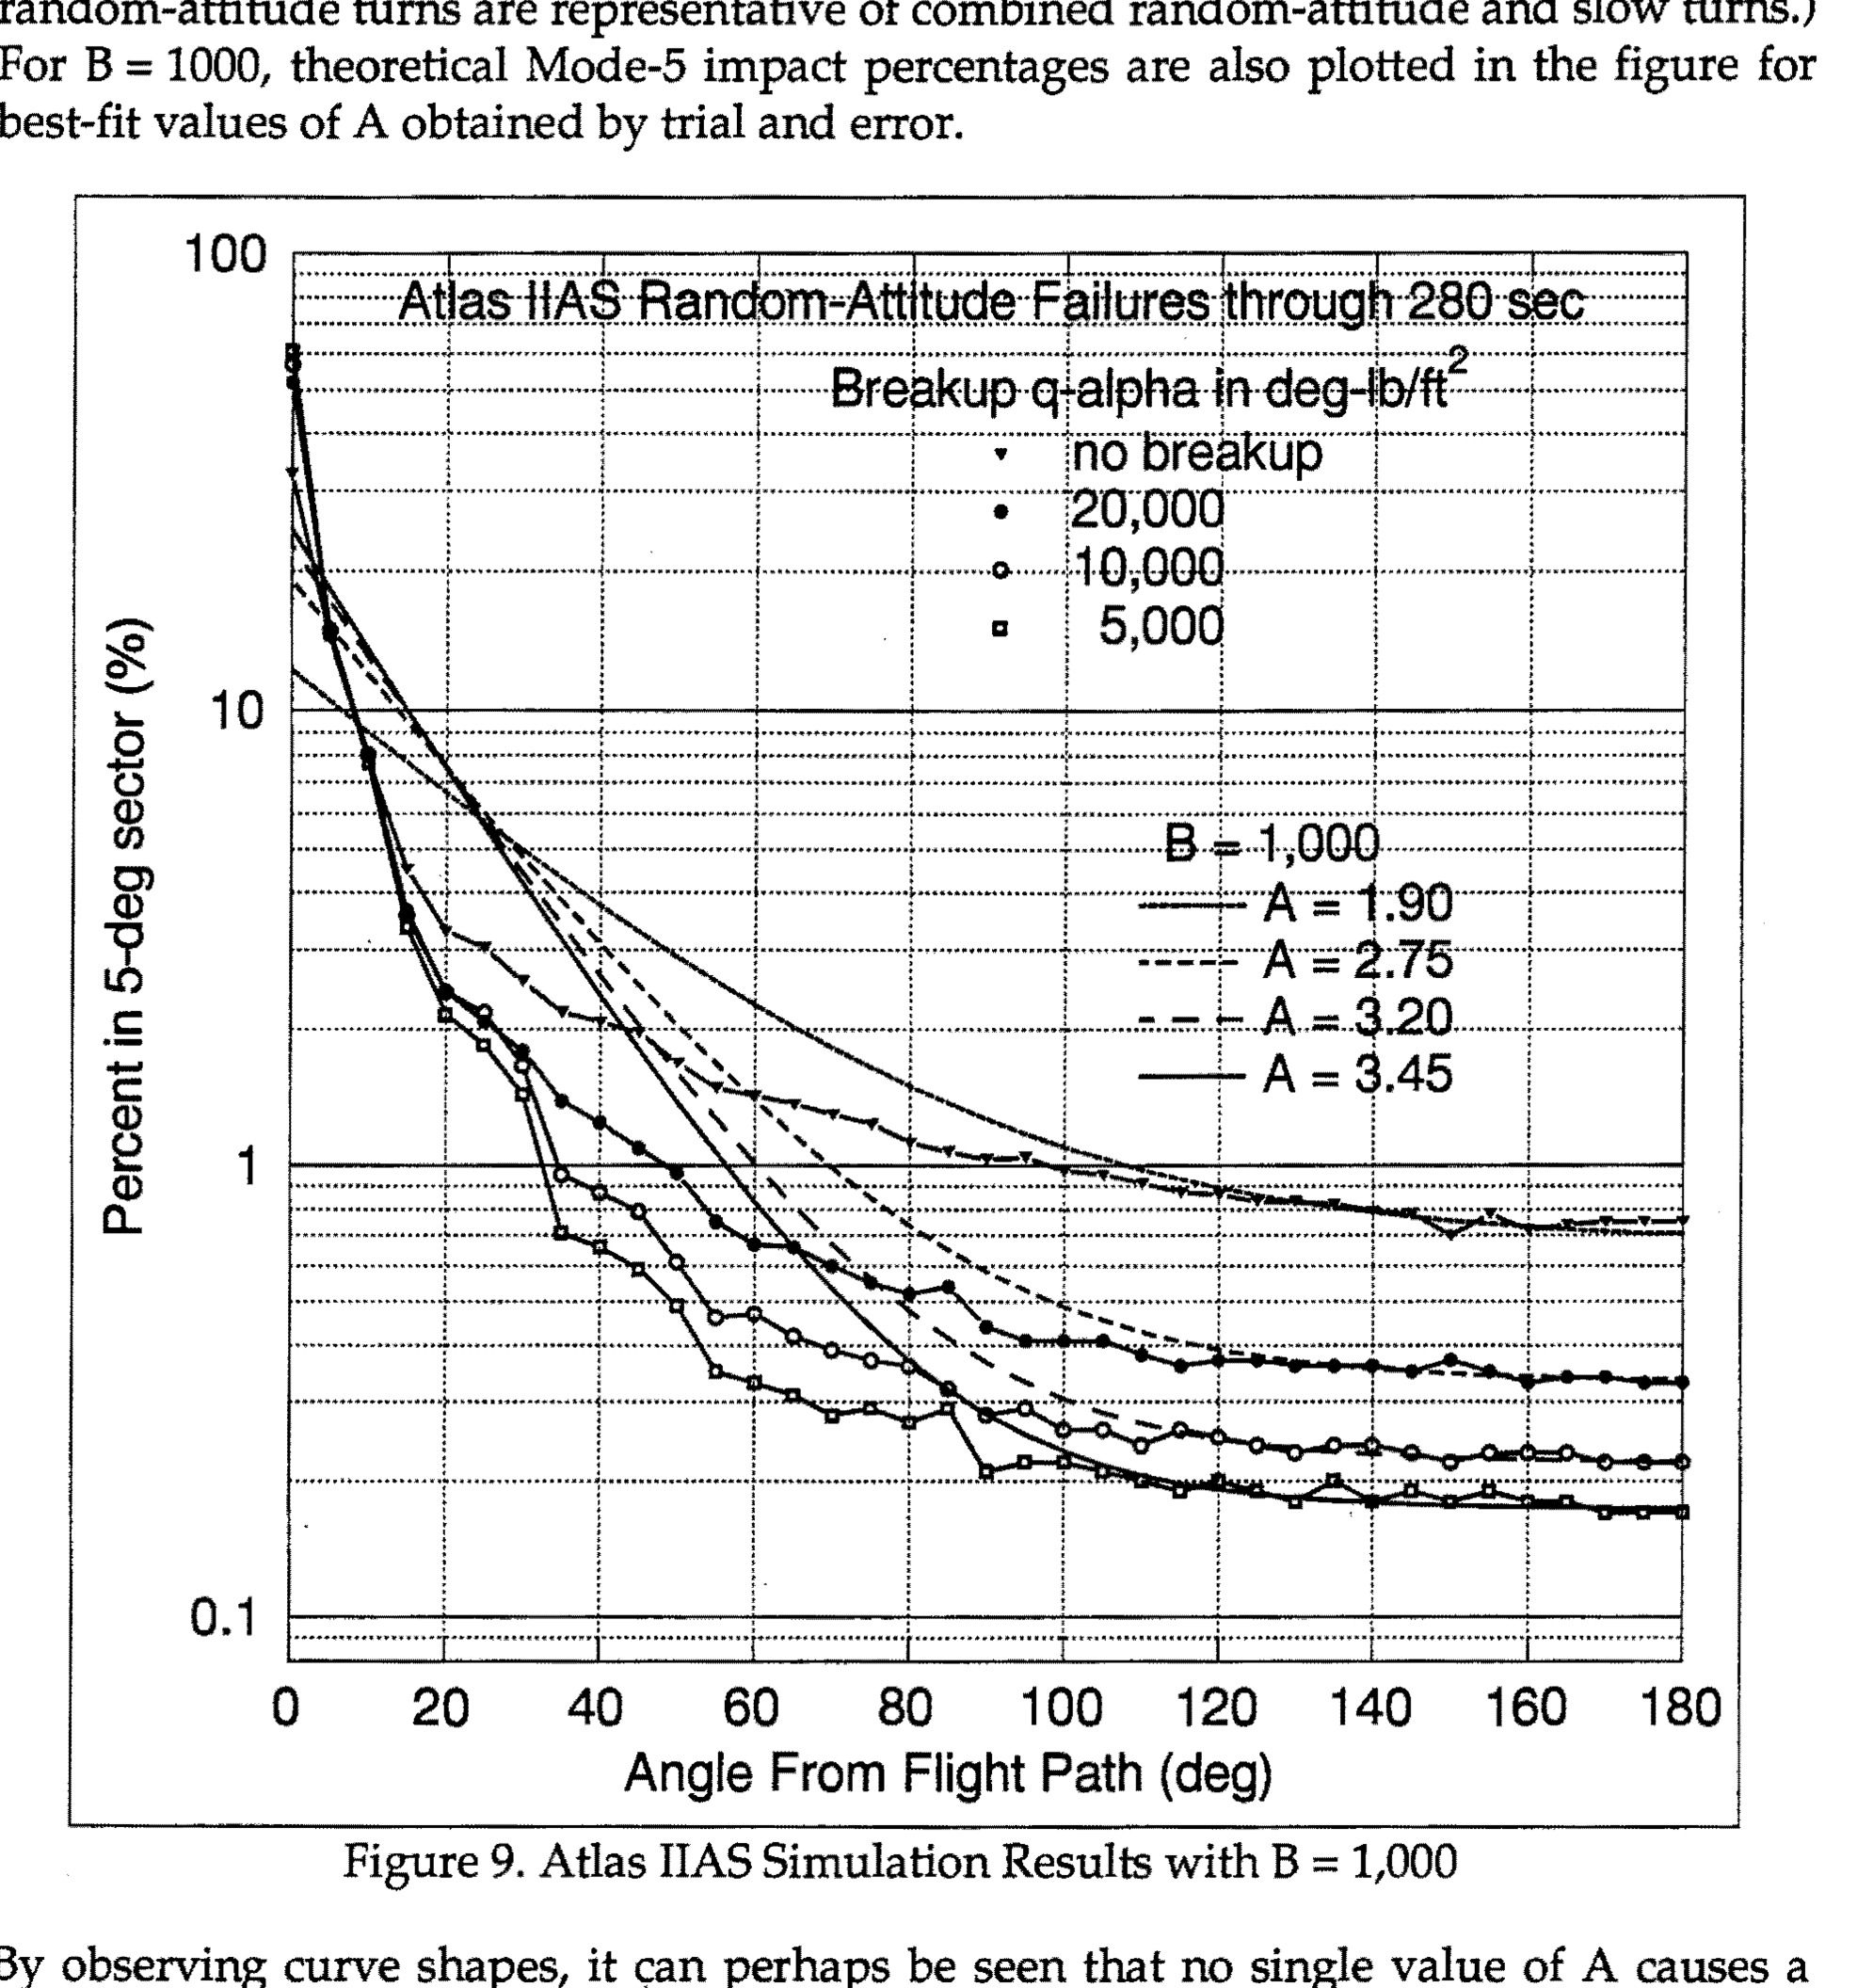
Figure 9. Atlas IIAS Simulation Results with B = 1,000
Chart· p.58· RTI
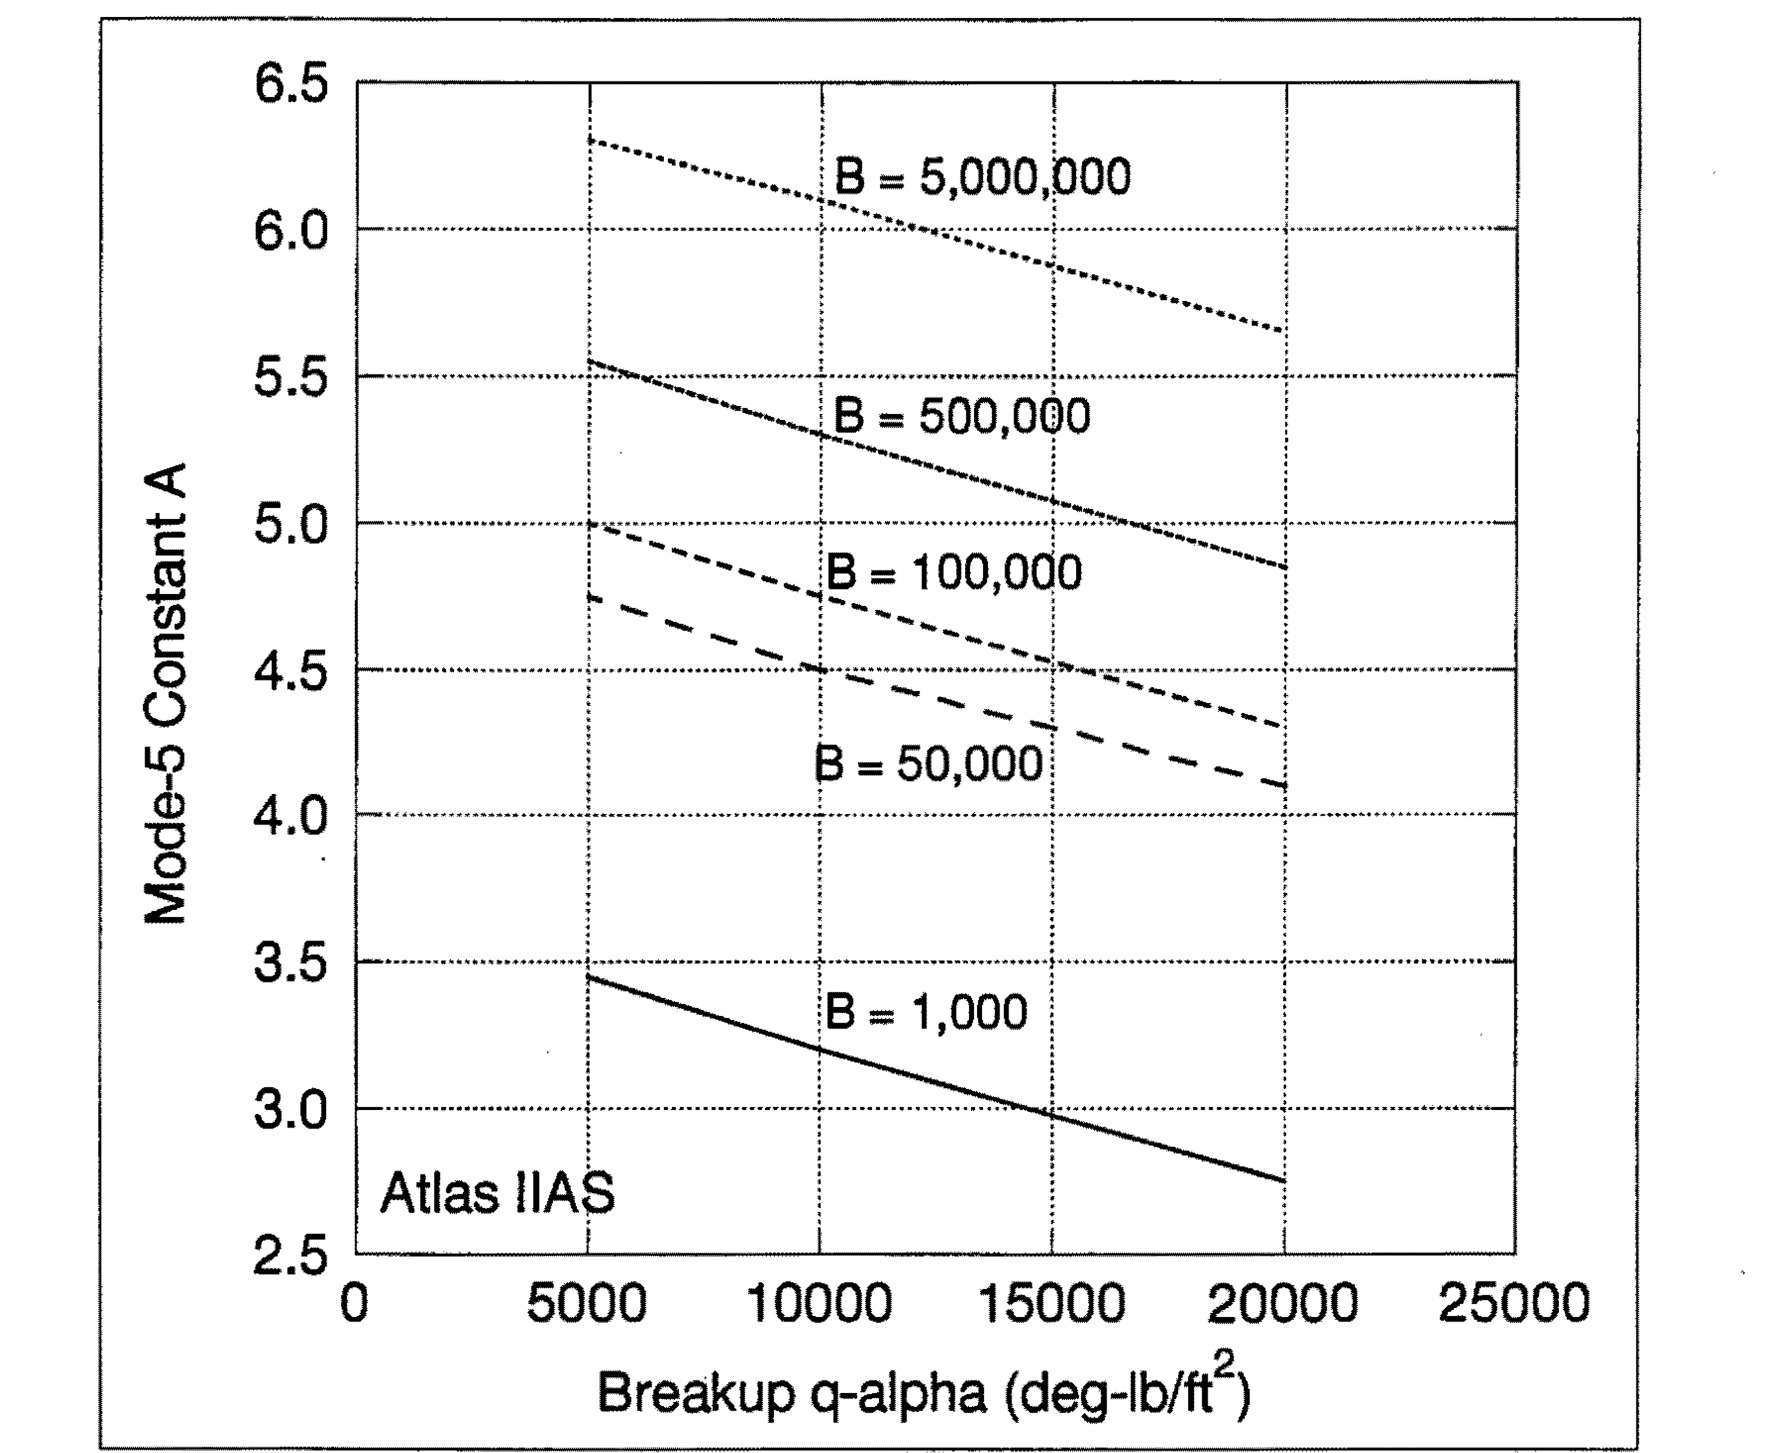
Figure 14. Effects of Breakup q-alpha on A for Atlas IIAS
Chart· p.60· RTI
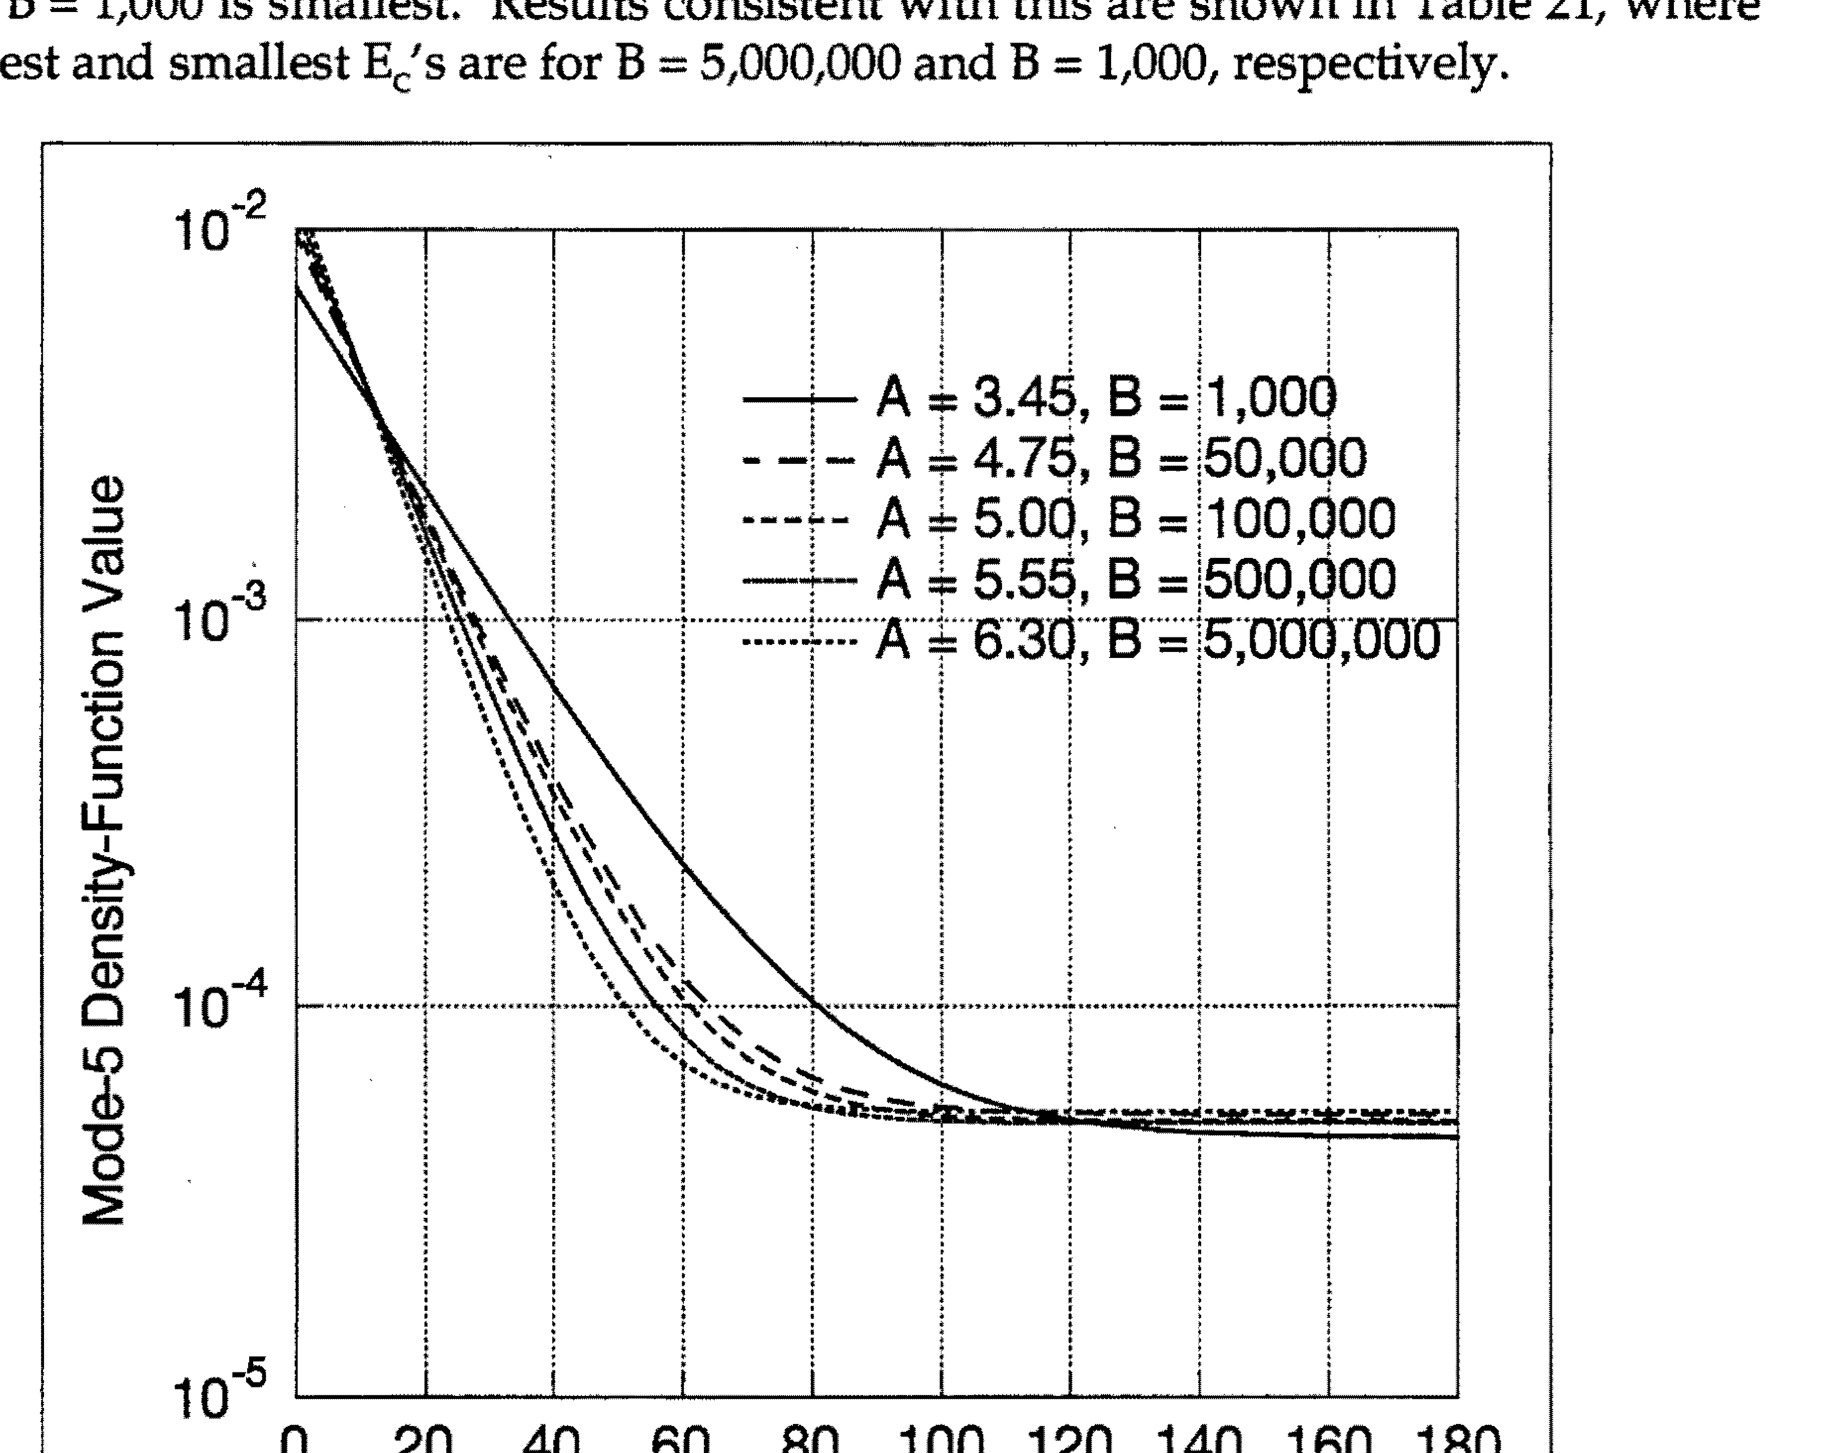
Figure 15. Mode-5 Density-Function Values at Three Miles
Chart· p.62· RTI
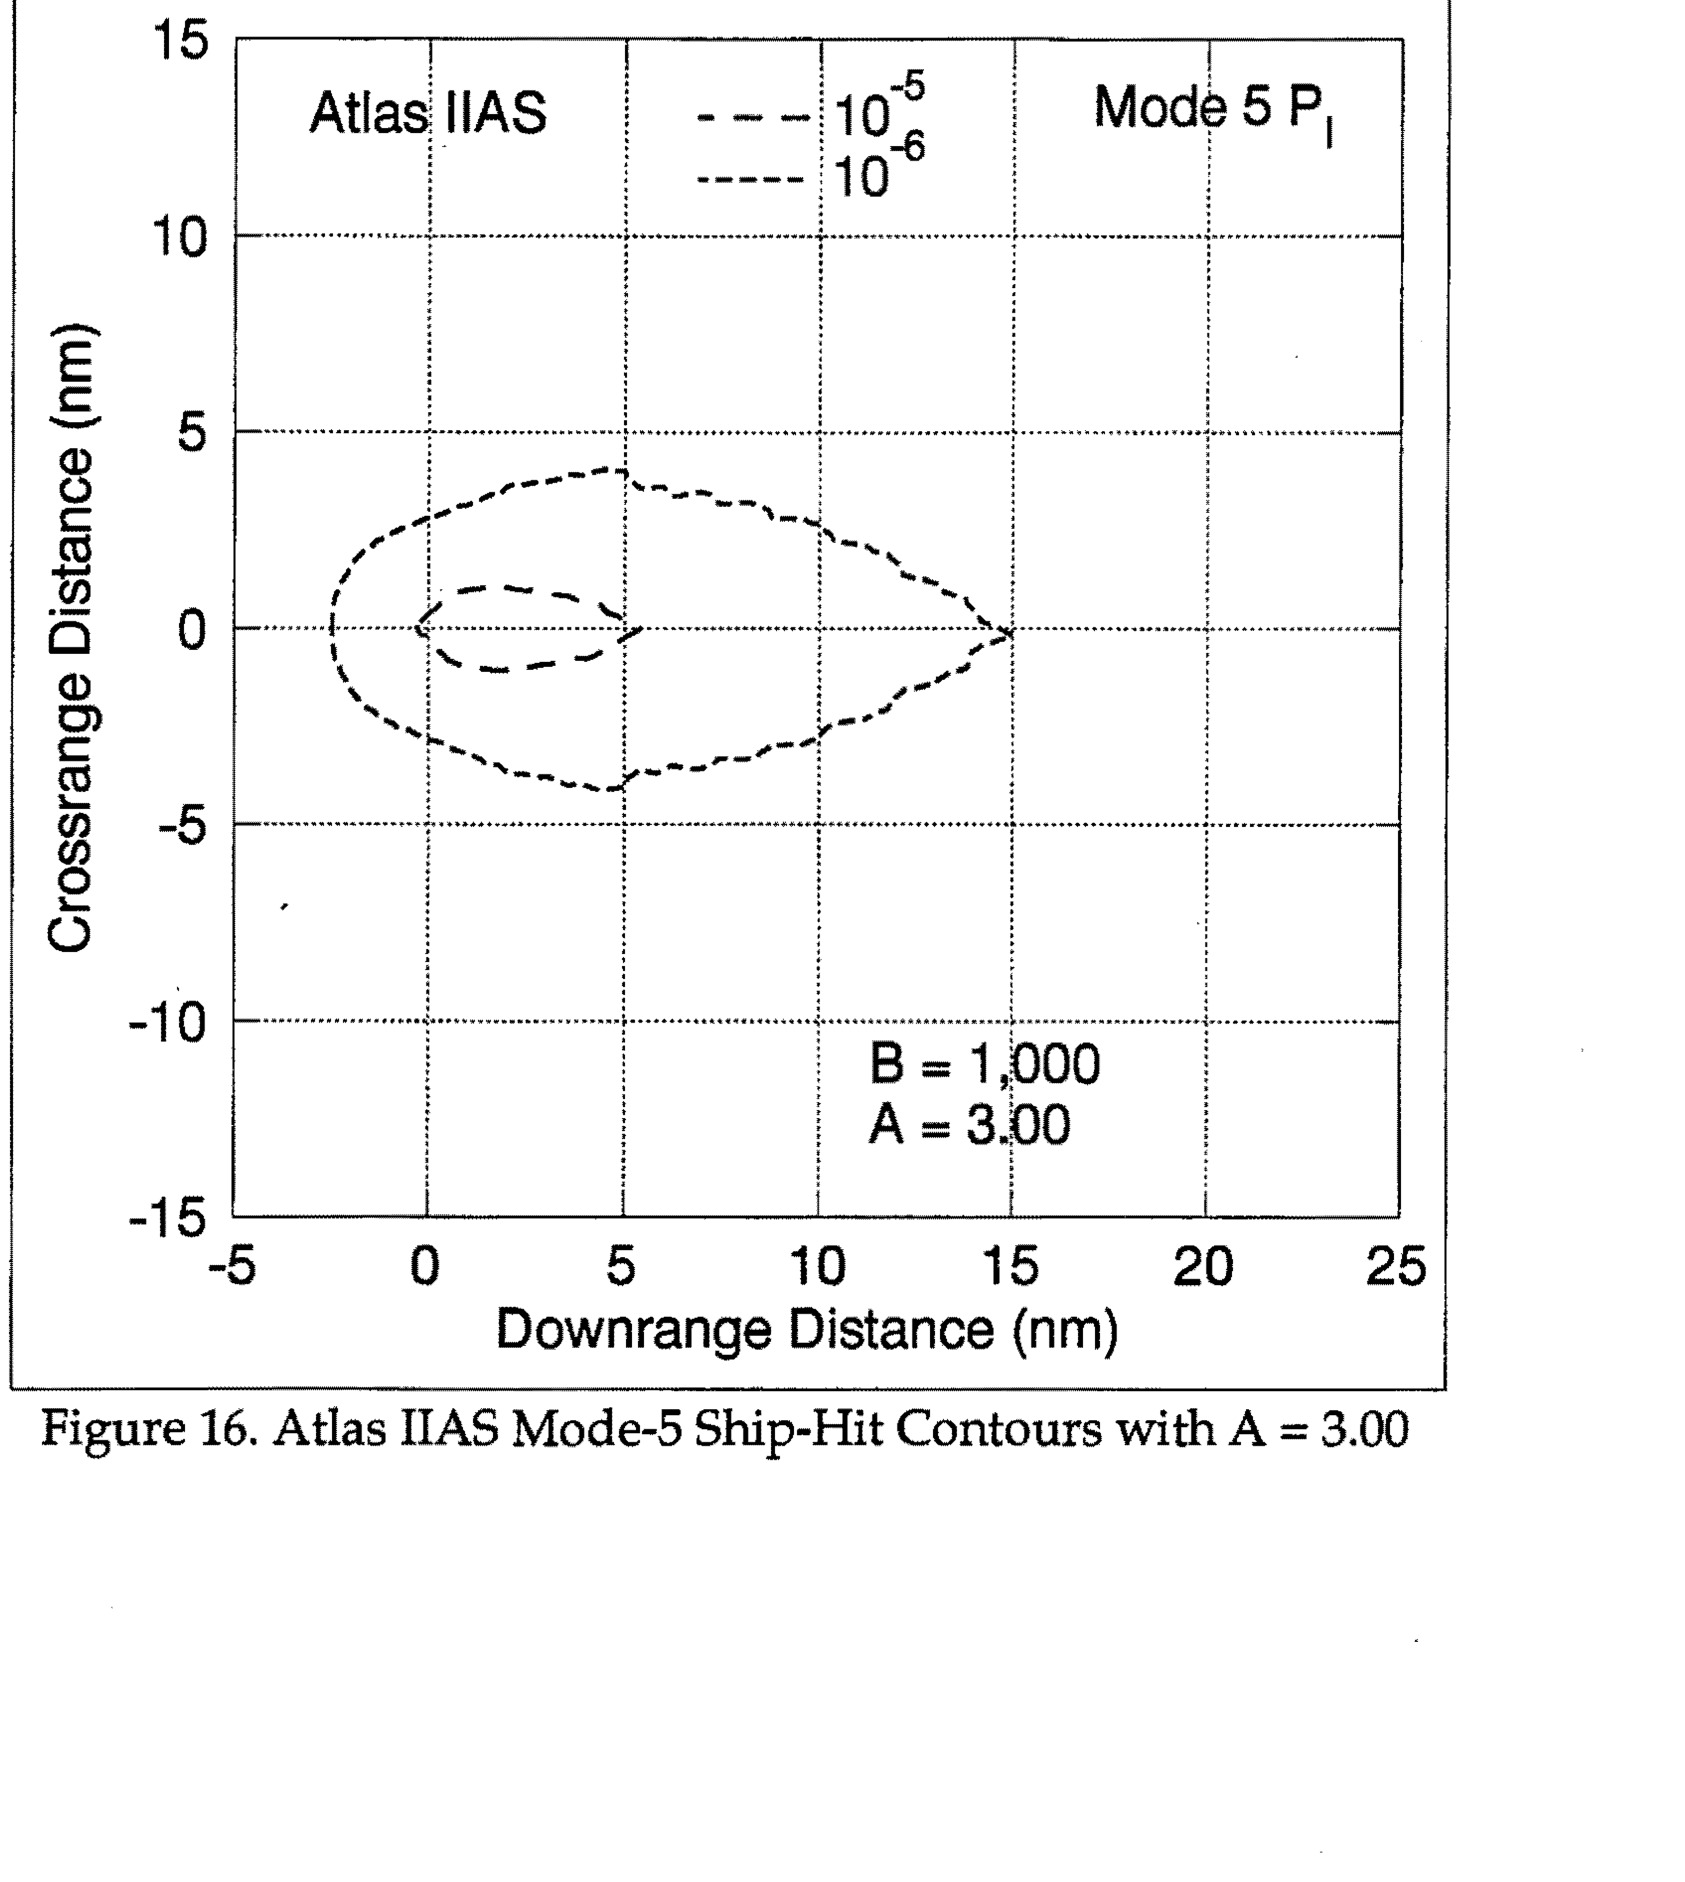
Atlas IIAS Mode-5 Ship-Hit Contours with A = 3.00, showing crossrange distance vs downrange distance with contour lines for 10^-5 and 10^-6, B = 1,000 and A = 3.00
Chart· p.67· RTI
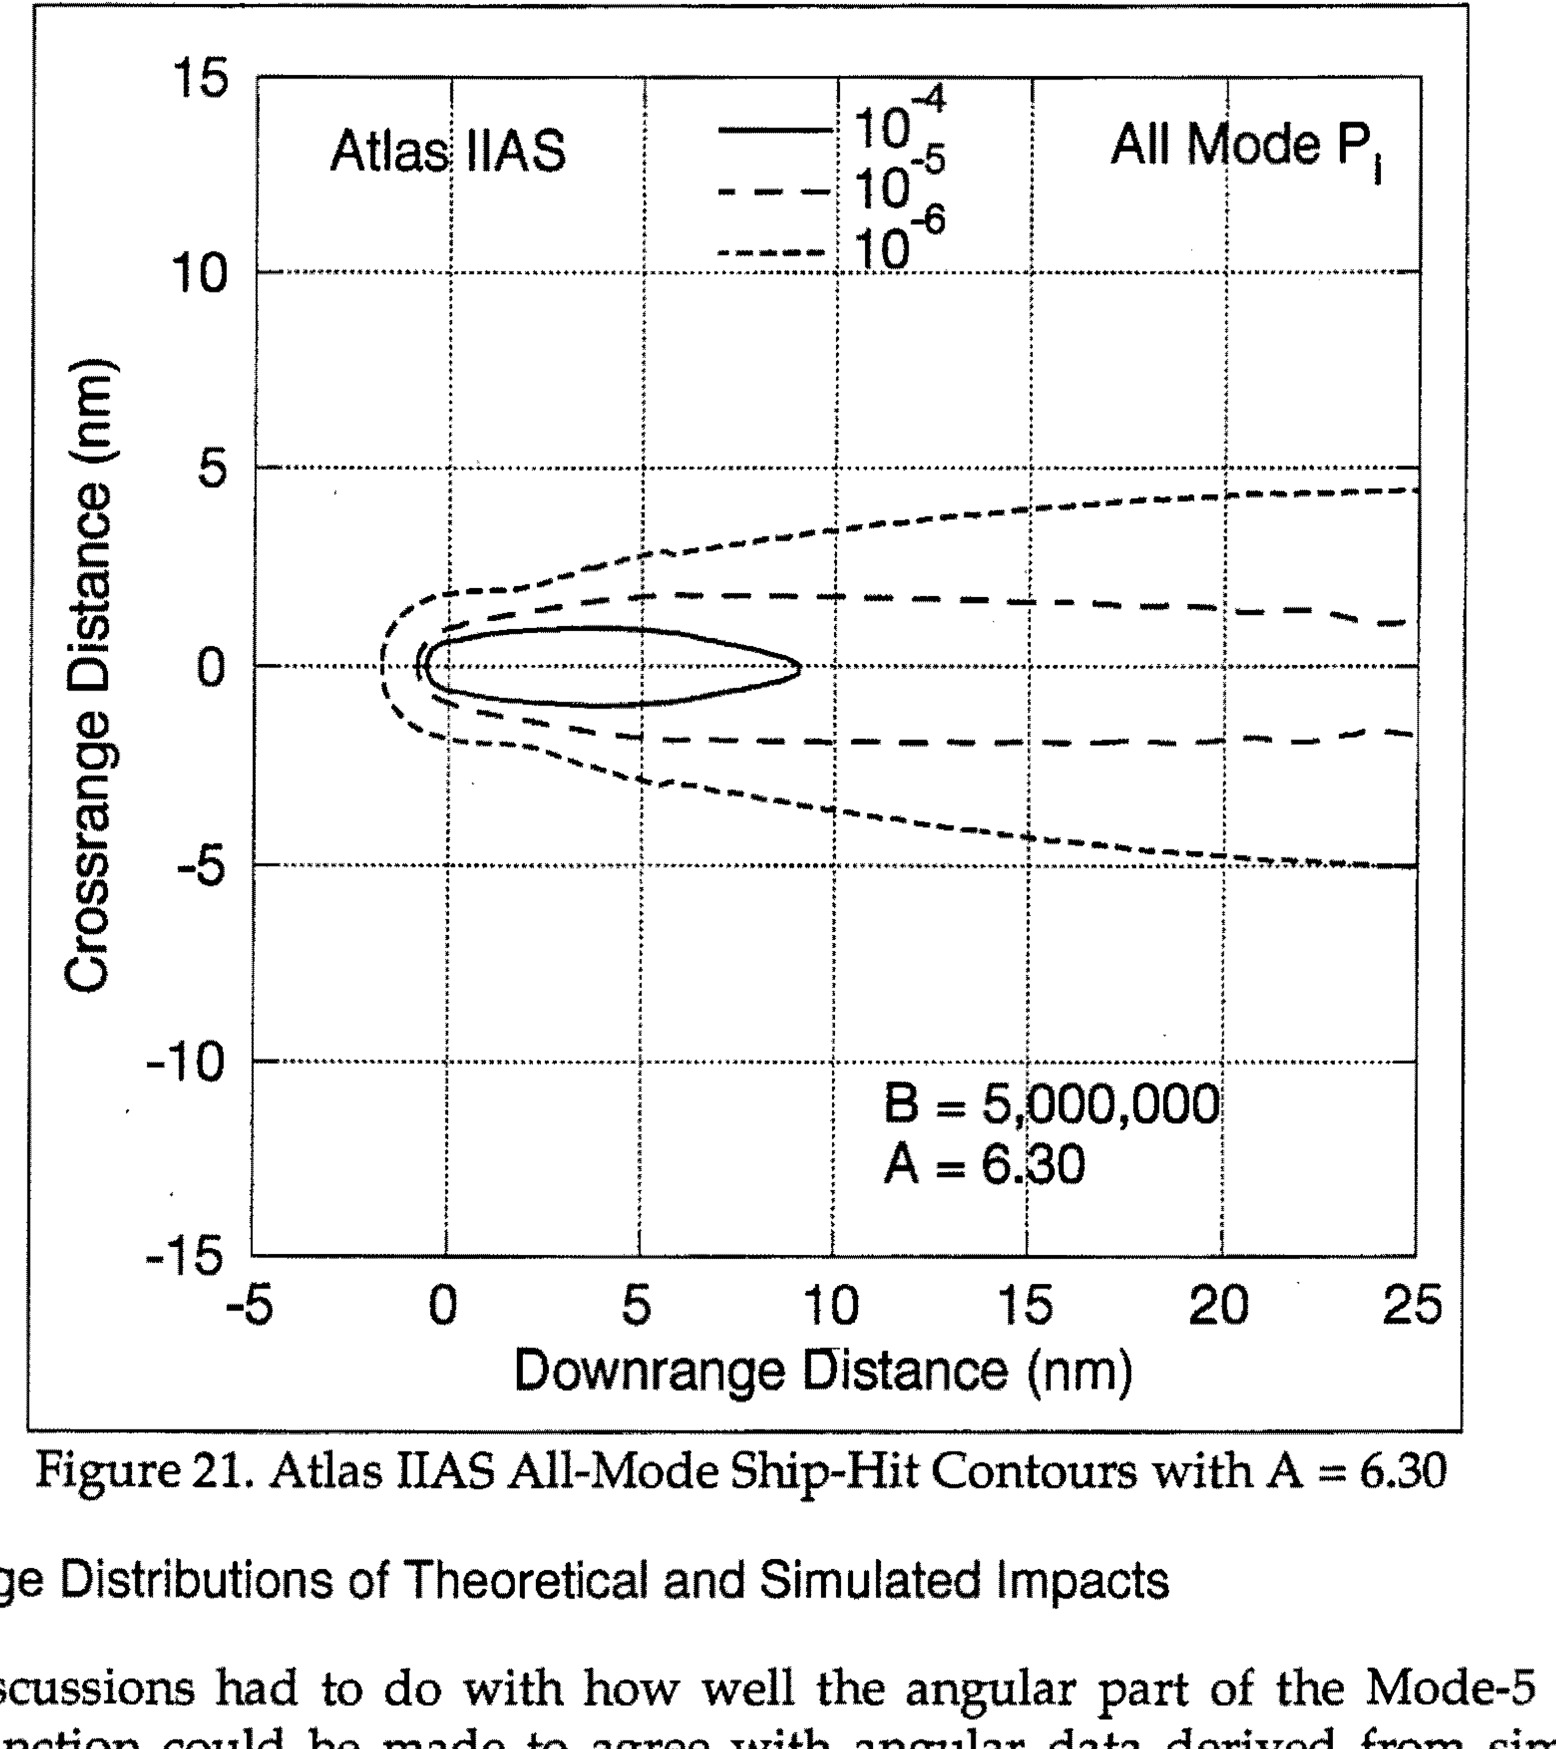
Figure 21. Atlas IIAS All-Mode Ship-Hit Contours with A = 6.30
Chart· p.68· RTI
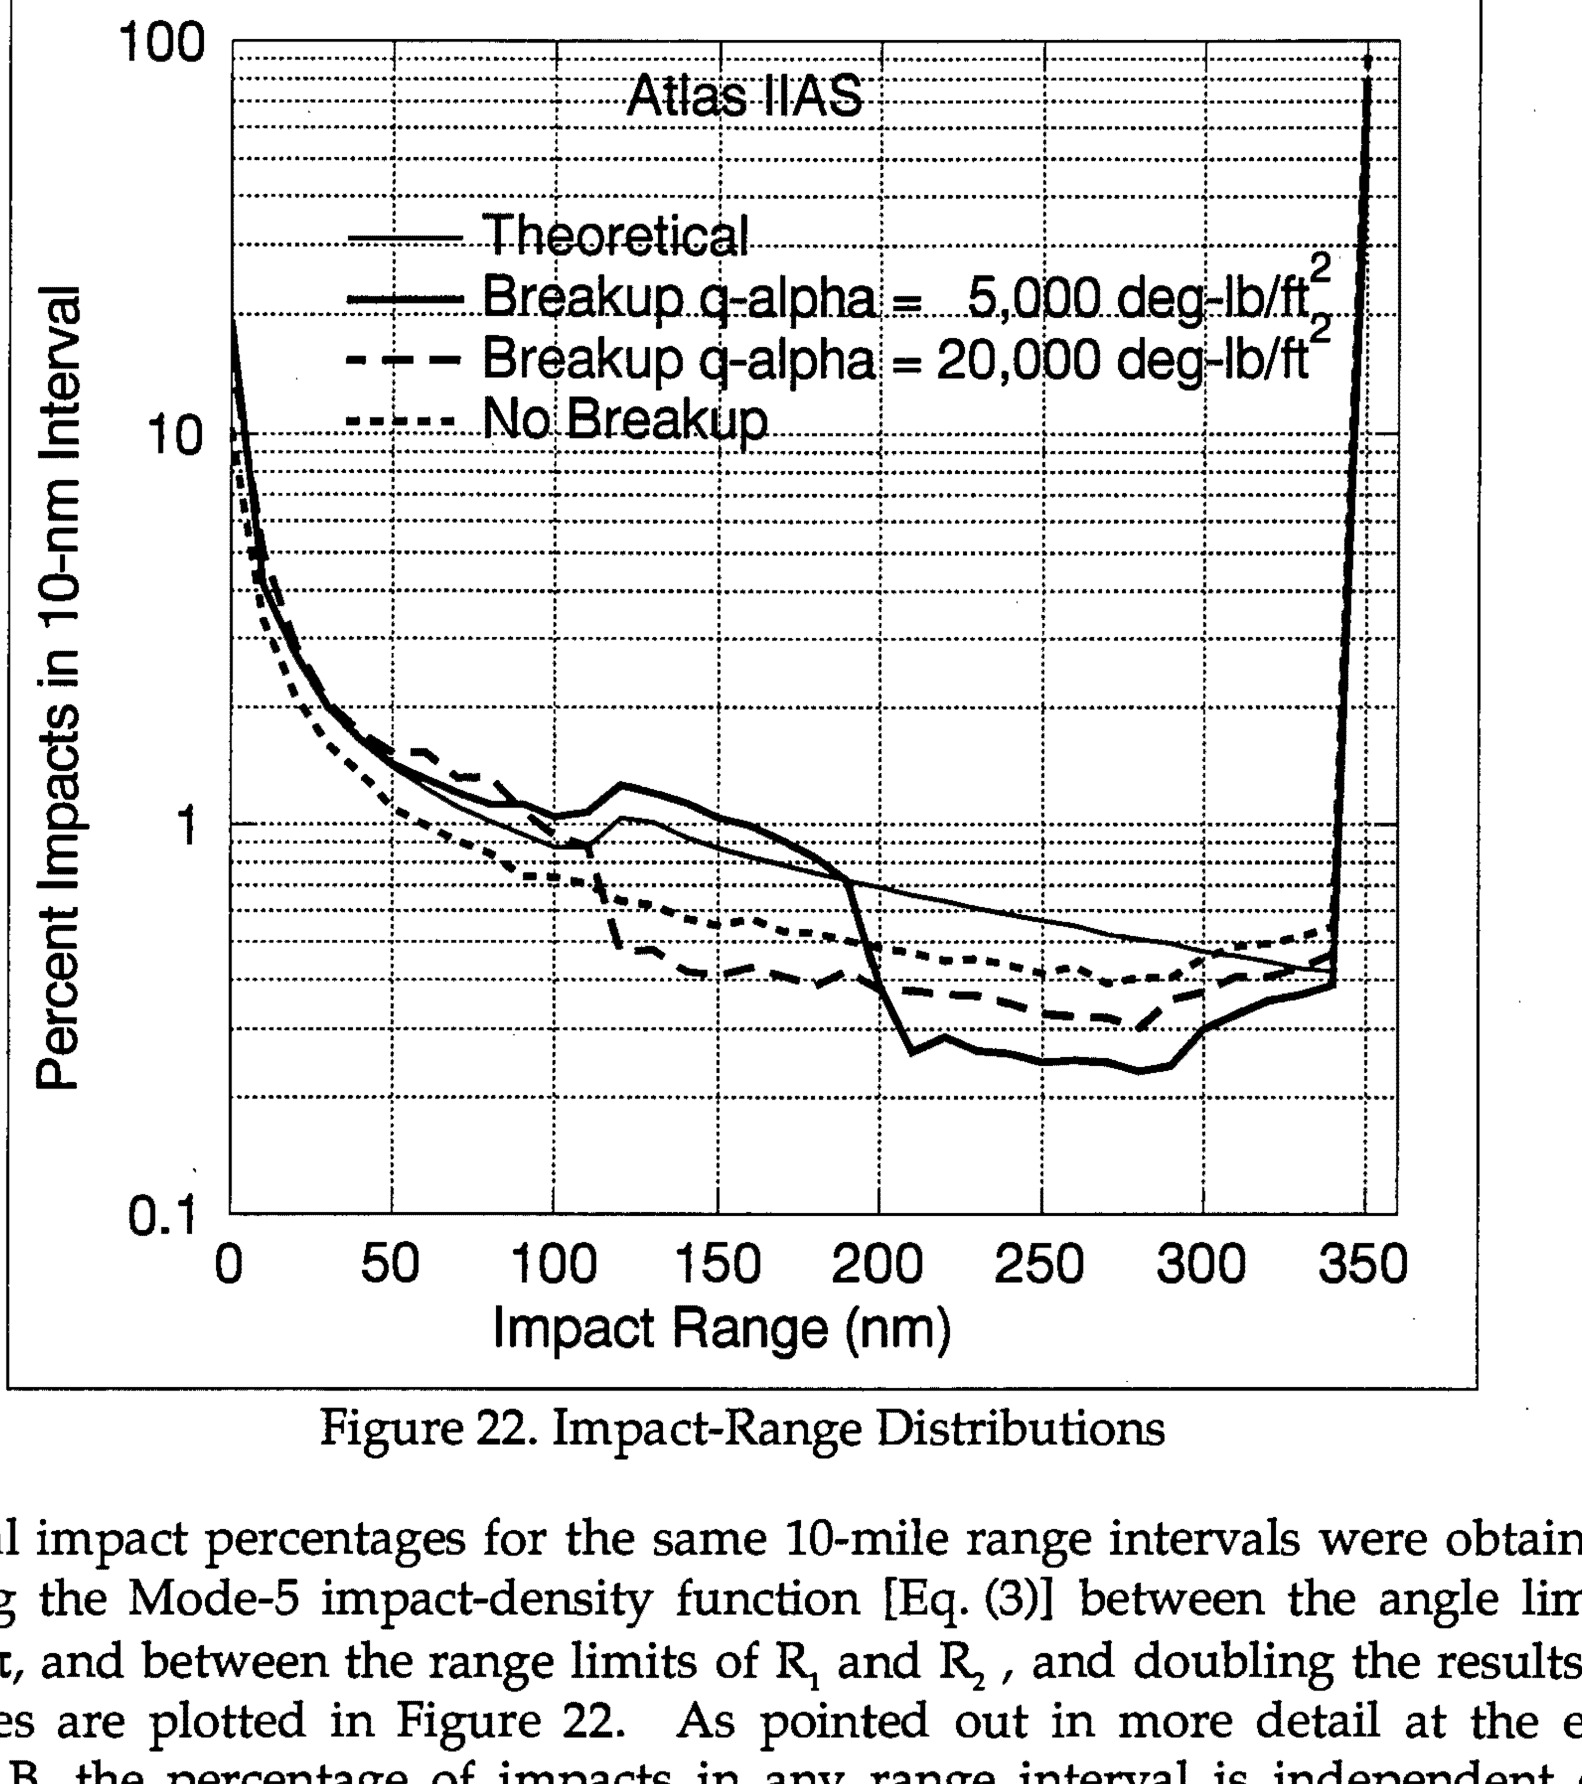
Figure 22. Impact-Range Distributions - Graph showing percent impacts in 10-nm interval vs impact range (nm) with Atlas IIAS theoretical and breakup q-alpha curves